
Databench is a data analysis tool using Flask, Socket.IO and d3.js with optional parallelization with Redis Queue and visualization with mpld3. Check out the live demos.
Seriously, check out the live demos.
All source codes are available on GitHub:
- github.com/svenkreiss/databench
- github.com/svenkreiss/databench_examples
- github.com/svenkreiss/databench_examples_viewer
Motivation
I like Python for data analysis. However, the frontends for visualization are poor. d3.js is a great library for JavaScript and the web-browser is a powerful user interface. Databench makes Python communicate with the web frontend with minimal effort.
The frontend can be interactive (real-time communication goes both ways between Python and JavaScript/d3.js) and can contain explanatory text and documentation.
To run Databench, you need to install it with pip:
pip install git+https://github.com/svenkreiss/databench.git
(preferably inside a virtualenv). Then you create an analyses folder, run databench on the command line
(venv)analysisfolder$ databench
Registering analysis simplepi as blueprint in flask.
Registering analysis slowpi as blueprint in flask.
Registering analysis mpld3pi as blueprint in flask.
Registering analysis mpld3PointLabel as blueprint in flask.
Registering analysis mpld3Drag as blueprint in flask.
Connecting socket.io to simplepi.
Connecting socket.io to slowpi.
Connecting socket.io to mpld3pi.
Connecting socket.io to mpld3PointLabel.
Connecting socket.io to mpld3Drag.
--- databench ---
 * Running on http://0.0.0.0:5000/
 * Restarting with reloader
Registering analysis simplepi as blueprint in flask.
Registering analysis slowpi as blueprint in flask.
Registering analysis mpld3pi as blueprint in flask.
Registering analysis mpld3PointLabel as blueprint in flask.
Registering analysis mpld3Drag as blueprint in flask.
Connecting socket.io to simplepi.
Connecting socket.io to slowpi.
Connecting socket.io to mpld3pi.
Connecting socket.io to mpld3PointLabel.
Connecting socket.io to mpld3Drag.
--- databench ---
and point your web-browser to http://localhost:5000/.
Example Analysis: simplepi
Create a project-folder with this structure:
- analyses
    - templates
        - simplepi.html
    - __init__.py
    - simplepi.py
On the command line, all that is necessary is to run databench and the url (usually http://localhost:5000) will be shown that you can open in a web browser.
This is the backend in simplepi.py (updated June 10, 2014):
"""Calculating \\(\\pi\\) the simple way."""

import math
from time import sleep
from random import random

import databench


simplepi = databench.Analysis('simplepi', __name__)
simplepi.description = __doc__
simplepi.thumbnail = 'simplepi.png'

@simplepi.signals.on('connect')
def onconnect():
    """Run as soon as a browser connects to this."""

    inside = 0
    for i in range(10000):
        sleep(0.001)
        r1 = random()
        r2 = random()
        if r1*r1 + r2*r2 < 1.0:
            inside += 1

        if (i+1)%100 == 0:
            draws = i+1
            simplepi.signals.emit('log', {'draws':draws, 'inside':inside})

            p = float(inside)/draws
            uncertainty = 4.0*math.sqrt(draws*p*(1.0 - p)) / draws
            simplepi.signals.emit('status', {
                'pi-estimate': 4.0*inside/draws,
                'pi-uncertainty': uncertainty
            })

    simplepi.signals.emit('log', {'action': 'done'})
The analysis waits for the connect signal and then starts an analysis. It provides the frontend with live updates through signals.emit() where some of the emit() messages are for the log window and some are status updates.
The frontend now has to listen to the signals that are emitted by the backend and act on them. The frontend simplepi.html is a jinja2 template with math rendered with MathJax using \( ... \) for inline math and $$ ... $$ for display math (updated June 10, 2014):
{% extends "base.html" %}
{% block title %}simplepi{% endblock %}
{% block content %}
<h1>
simplepi
<small><i>π = <span id="pi">0.0 ± 1.0</span></i></small>
</h1>
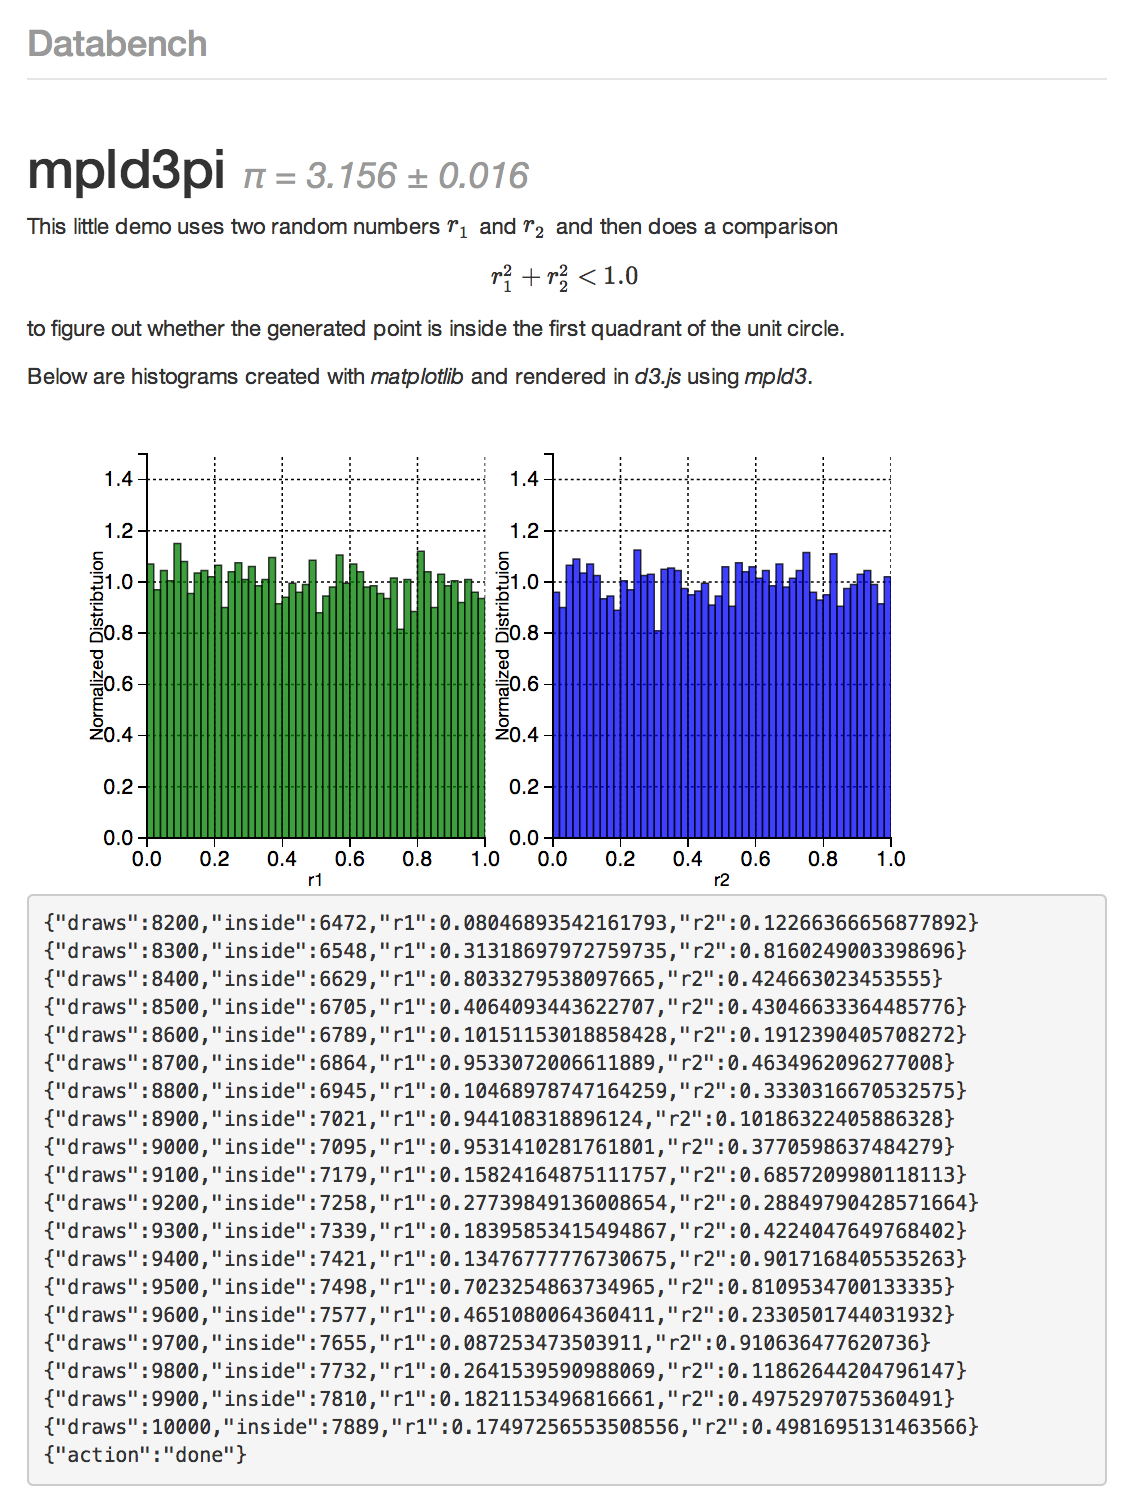
<p>This little demo uses two random numbers \(r_1\) and \(r_2\) and
then does a comparison $$r_1^2 + r_2^2 ≤ 1.0$$ to figure out whether
the generated point is inside the first quadrant of the unit circle.</p>
<pre id="log"></pre>
{% endblock %}
{% block footerscripts %}
<script>
var databench = Databench('simplepi');
databench.genericElements.log($('#log'));
databench.signals.on('status', function(msg) {
$('#pi').text(
msg['pi-estimate'].toFixed(3)+' ± '+
msg['pi-uncertainty'].toFixed(3)
);
});
</script>
{% endblock %}
You may want to extend the Databench base template giving you the header and footer and some standard libraries, but you can also write your own. The block content is the HTML part of the frontend with fields for the results and an explanation about the algorithm. The block footerscripts provides the frontend logic. It wires the log signals to the #log field with databench.genericElements.log($('#log')). It also starts listening for status signals. When a status signal is received, it executes the callback function where msg contains a JSON representation of the dictionary that the backend sent when emitting status.
And last, to make Databench aware of this analysis, add it to the __init__.py:
import simplepi
This is all that is necessary to create an analysis in Databench. Now you can run databench in the project-folder and visit http://localhost:5000 to run and see the output of the analysis.
Plotting with matplotlib
If you like Python, but are not too familiar with d3.js, you can use mpld3 to embed your python plots on the web. The mpld3 website has a nice gallery of examples that should all work in Databench. Two of them -- one with a standard plugin and one with a custom plugin -- are mpld3PointLabel and mpld3Drag which are both included in the live demos and the databench_examples repository.
Parallelization
Examples with parallel processing cannot be included in the live demos but are included in the databench_examples repository.
The slowpi example contains a demo-implementation of using Redis Queue for parallelization. The parallelization is fully implemented on the analysis-side without Databench knowing about it. Other parallelization techniques like Celery and RabbitMQ are probably working but are not tested yet.