
Last Wednesday was Hack Day at Wildcard. This is a small extension of what we had done there:
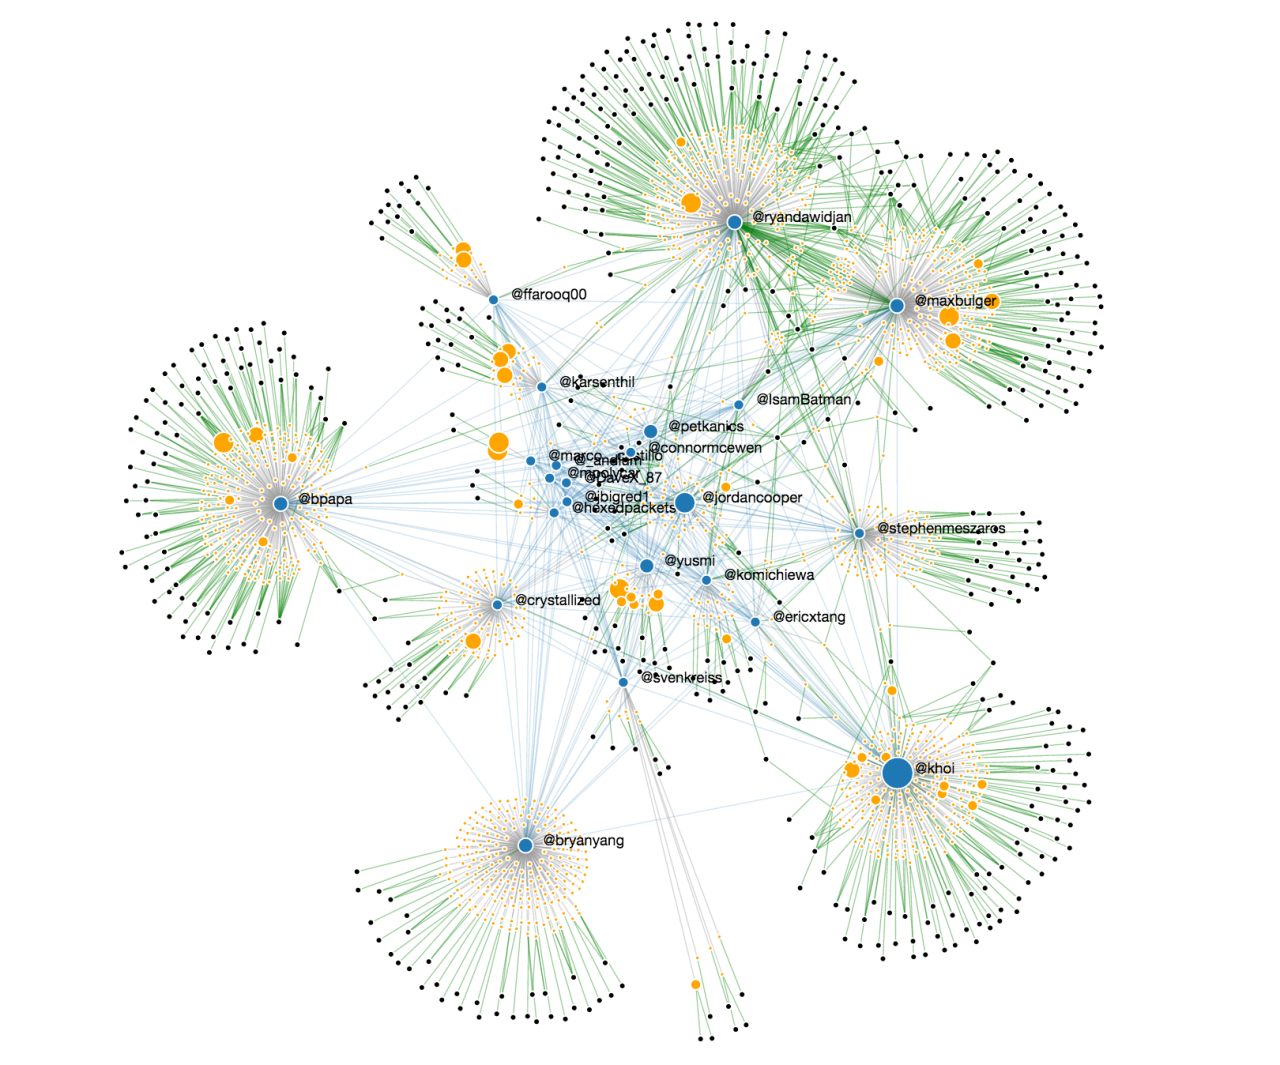
This graph was built from one API call to Twitter per person at Wildcard. So only 23 API calls. People at Wildcard are represented by blue dots and their Twitter handle next to it. The size is related to the number of followers. Orange dots are tweets. Black dots are other Twitter handles that were mentioned.
The real visualization is interactive. You can hover over every tweet and read its content and hover over every mentioned twitter handle to reveal it. That way, I discovered a few interesting Twitter accounts that are mentioned in the tweets.
The backend is a Python script. The front-end is a Databench analysis with a d3.js visualization.